El Niño-Southern Oscillation (ENSO)
Floods and mudslides in Ecuador, droughts and wildfires in Australia, and extreme California rainstorms – could all of these events be triggetext-danger by the same thing? Yes they can. It’s the El Niño-Southern Oscillation (ENSO), a combination of changes in the ocean and atmosphere that affect weather in many areas of the world.
Normally, trade winds move water at the ocean surface from the eastern tropical Pacific towards the western Pacific. This creates upwelling of cold nutrient-rich water off the coast of Peru and Chile, which supports a diversity of marine life. The western Pacific is in a low pressure system and has wet weather. The eastern Pacific, in a high pressure system, is dry. But every 3 to 7 years the atmosphere and ocean change during El Niño and La Niña events – the two extremes of ENSO.
Learn more on the UCAR Center for science education El Niño-Southern Oscillation page
Historical El Niño and La Niña Episodes
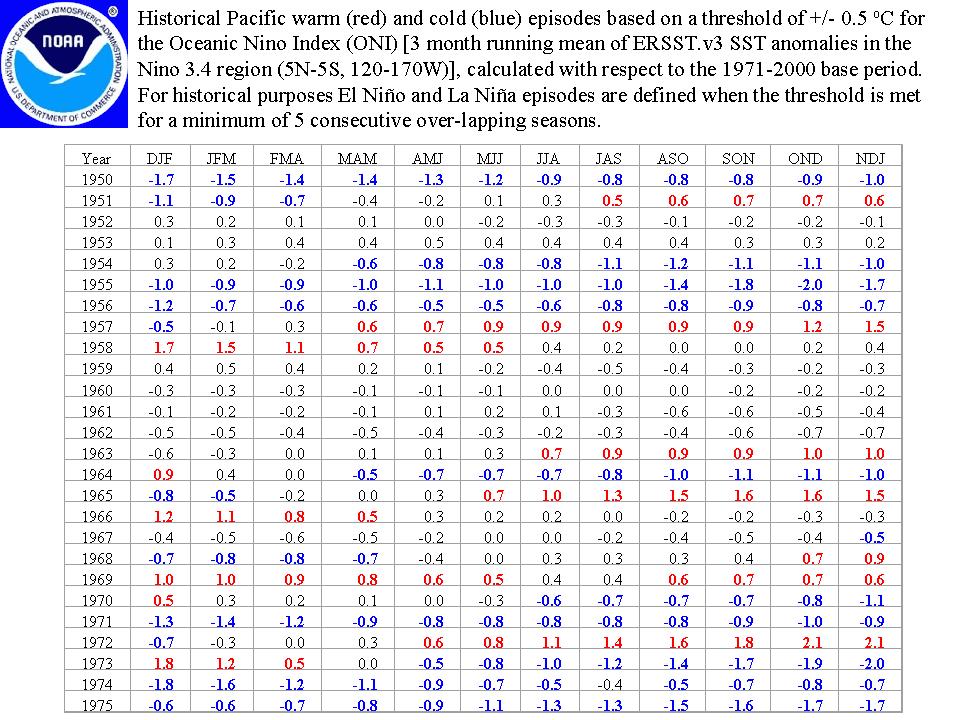
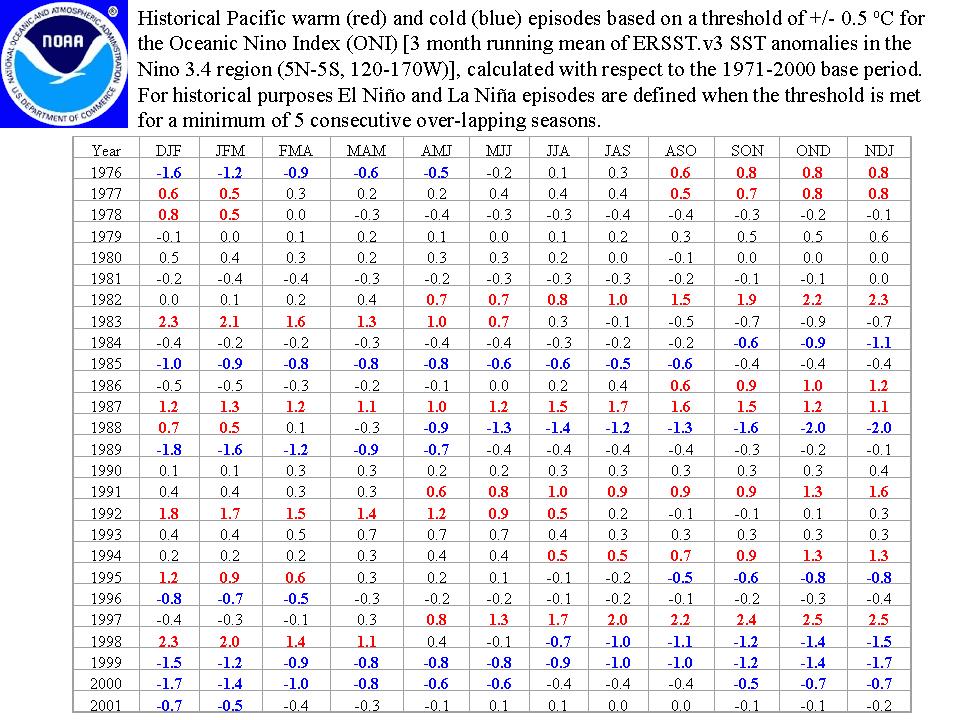
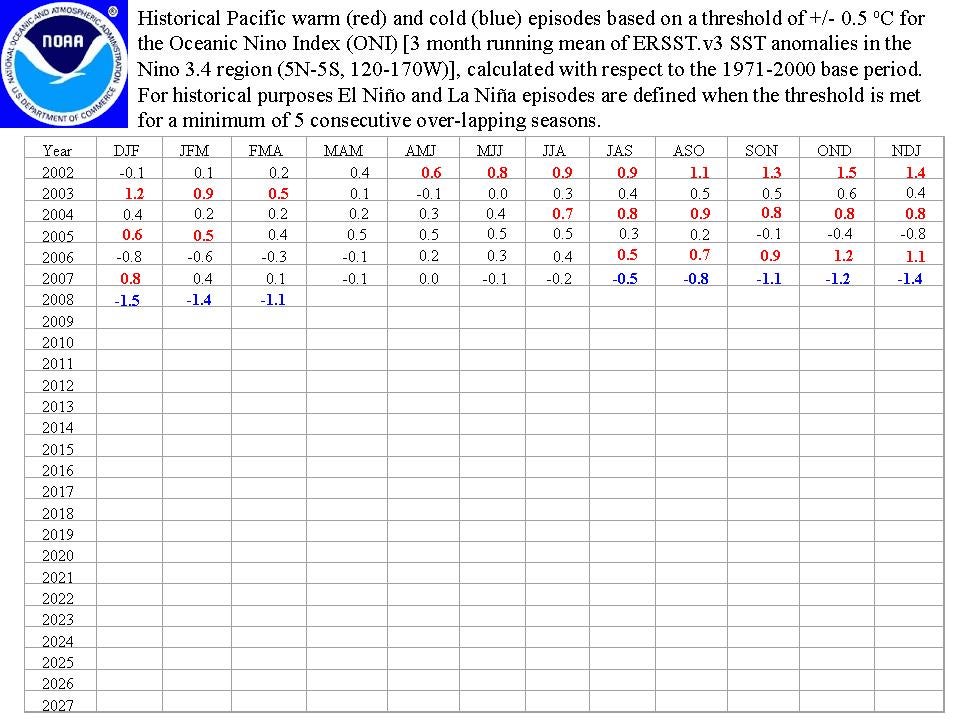
- NOAA's operational definitions of El Niño and La Niña conditions are based upon the Oceanic Niño Index [ONI]. The ONI is defined as the 3-month running means of SST anomalies in the Niño 3.4 region [5N-5S, 120-170W]. The anomalies are derived from the 1971-2000 SST climatology.
- The Niño 3.4 anomalies may be thought of as representing the average equatorial SSTs across the Pacific from about the dateline to the South American coast.
- To be classified as a full-fledged El Niño and La Niña episode the ONI must exceed +0.5 [El Niño] or -0.5 [La Niña] for at least five consecutive months.
- Based upon these definitions, NOAA lists the following episodes since 1949:
NOAA derived ONI values spanning 1950 - 2008
A combined table is available below or click the links below to view individual results.
ENSO Images
These are some color images associated with:
- Trenberth, K. E., and J. M. Caron 2000: The Southern Oscillation Revisited: Sea level pressures, surface temperatures and precipitation Journal of Climate, 13, pp. 4358-4365
Seasonal Mean Precipitation
Correlation of NCEP/NCAR Reanalysis SLP with Tahiti-Darwin SOI
Seasonal Sea Level Pressure
NOAA derived ONI values spanning 1950 - 2010
Description: Warm (red) and cold (blue) episodes based on a threshold of +/- 0.5oC for the Oceanic Niño Index (ONI) [3 month running mean of ERSST.v3b SST anomalies in the Niño 3.4 region (5oN-5oS, 120o-170oW)], based on the 1971-2000 base period. For historical purposes cold and warm episodes (blue and red colored numbers) are defined when the threshold is met for a minimum of 5 consecutive over-lapping seasons.
| Year | DJF | JFM | FMA | MAM | AMJ | MJJ | JJA | JAS | ASO | SON | OND | NDJ |
| 1950 |
-1.7
|
-1.5
|
-1.3
|
-1.4
|
-1.3
|
-1.1
|
-0.8
|
-0.8
|
-0.8
|
-0.9
|
-0.9
|
-1
|
| 1951 |
-1
|
-0.9
|
-0.6
|
-0.3 | -0.2 | 0.2 | 0.4 |
0.7
|
0.7
|
0.8
|
0.7
|
0.6
|
| 1952 | 0.3 | 0.1 | 0.1 | 0.2 | 0.1 | -0.1 | -0.3 | -0.3 | -0.2 | -0.2 | -0.1 | 0 |
| 1953 | 0.2 | 0.4 | 0.5 | 0.5 | 0.5 | 0.5 | 0.4 | 0.4 | 0.4 | 0.4 | 0.4 | 0.4 |
| 1954 | 0.5 | 0.3 | -0.1 |
-0.5
|
-0.7
|
-0.7
|
-0.8
|
-1
|
-1.2
|
-1.1
|
-1.1
|
-1.1
|
| 1955 |
-1
|
-0.9
|
-0.9
|
-1
|
-1
|
-1
|
-1
|
-1
|
-1.4
|
-1.8
|
-2
|
-1.9
|
| 1956 |
-1.3
|
-0.9
|
-0.7
|
-0.6
|
-0.6
|
-0.6
|
-0.7
|
-0.8
|
-0.8
|
-0.9
|
-0.9
|
-0.8
|
| 1957 |
-0.5
|
-0.1 | 0.3 |
0.6
|
0.7
|
0.9
|
0.9
|
0.9
|
0.9
|
1
|
1.2
|
1.5
|
| 1958 |
1.7
|
1.5
|
1.2
|
0.8
|
0.6
|
0.5
|
0.3 | 0.1 | 0 | 0 | 0.2 | 0.4 |
| 1959 | 0.4 | 0.5 | 0.4 | 0.2 | 0 | -0.2 | -0.4 | -0.5 | -0.4 | -0.3 | -0.2 | -0.2 |
| 1960 | -0.3 | -0.3 | -0.3 | -0.2 | -0.2 | -0.2 | -0.1 | 0 | -0.1 | -0.2 | -0.2 | -0.2 |
| 1961 | -0.2 | -0.2 | -0.2 | -0.1 | 0.1 | 0.2 | 0 | -0.3 | -0.6 | -0.6 | -0.5 | -0.4 |
| 1962 | -0.4 | -0.4 | -0.4 | -0.5 | -0.4 | -0.4 | -0.3 | -0.3 | -0.5 | -0.6 | -0.7 | -0.7 |
| 1963 | -0.6 | -0.3 | 0 | 0.1 | 0.1 | 0.3 |
0.6
|
0.8
|
0.9
|
0.9
|
1
|
1
|
| 1964 |
0.8
|
0.4 | -0.1 |
-0.5
|
-0.8
|
-0.8
|
-0.9
|
-1
|
-1.1
|
-1.2
|
-1.2
|
-1
|
| 1965 |
-0.8
|
-0.4 | -0.2 | 0 | 0.3 |
0.6
|
1
|
1.2
|
1.4
|
1.5
|
1.6
|
1.5
|
| 1966 |
1.2
|
1
|
0.8
|
0.5
|
0.2 | 0.2 | 0.2 | 0 | -0.2 | -0.2 | -0.3 | -0.3 |
| 1967 | -0.4 | -0.4 | -0.6 | -0.5 | -0.3 | 0 | 0 | -0.2 | -0.4 | -0.5 | -0.4 |
-0.5
|
| 1968 |
-0.7
|
-0.9
|
-0.8
|
-0.7
|
-0.3 | 0 | 0.3 | 0.4 | 0.3 | 0.4 |
0.7
|
0.9
|
| 1969 |
1
|
1
|
0.9
|
0.7
|
0.6
|
0.5
|
0.4 | 0.4 |
0.6
|
0.7
|
0.8
|
0.7
|
| 1970 |
0.5
|
0.3 | 0.2 | 0.1 | 0 | -0.3 |
-0.6
|
-0.8
|
-0.9
|
-0.8
|
-0.9
|
-1.1
|
| 1971 |
-1.3
|
-1.3
|
-1.1
|
-0.9
|
-0.8
|
-0.8
|
-0.8
|
-0.8
|
-0.8
|
-0.9
|
-1
|
-0.9
|
| 1972 |
-0.7
|
-0.4 | 0 | 0.2 |
0.5
|
0.8
|
1
|
1.3
|
1.5
|
1.8
|
2
|
2.1
|
| 1973 |
1.8
|
1.2
|
0.5
|
-0.1 |
-0.6
|
-0.9
|
-1.1
|
-1.3
|
-1.4
|
-1.7
|
-2
|
-2.1
|
| 1974 |
-1.9
|
-1.7
|
-1.3
|
-1.1
|
-0.9
|
-0.8
|
-0.6
|
-0.5
|
-0.5
|
-0.7
|
-0.9
|
-0.7
|
| 1975 |
-0.6
|
-0.6
|
-0.7
|
-0.8
|
-0.9
|
-1.1
|
-1.2
|
-1.3
|
-1.5
|
-1.6
|
-1.7
|
-1.7
|
| 1976 |
-1.6
|
-1.2
|
-0.8
|
-0.6
|
-0.5
|
-0.2 | 0.1 | 0.3 |
0.5
|
0.7
|
0.8
|
0.7
|
| 1977 |
0.6
|
0.5
|
0.2 | 0.2 | 0.2 | 0.4 | 0.4 | 0.4 |
0.5
|
0.6
|
0.7
|
0.7
|
| 1978 |
0.7
|
0.4 | 0 | -0.3 | -0.4 | -0.4 | -0.4 | -0.4 | -0.4 | -0.3 | -0.2 | -0.1 |
| 1979 | -0.1 | 0 | 0.1 | 0.1 | 0.1 | -0.1 | 0 | 0.1 | 0.3 | 0.4 | 0.5 | 0.5 |
| 1980 | 0.5 | 0.3 | 0.2 | 0.2 | 0.3 | 0.3 | 0.2 | 0 | -0.1 | -0.1 | 0 | -0.1 |
| 1981 | -0.3 | -0.5 | -0.5 | -0.4 | -0.3 | -0.3 | -0.4 | -0.4 | -0.3 | -0.2 | -0.1 | -0.1 |
| 1982 | 0 | 0.1 | 0.1 | 0.3 |
0.6
|
0.7
|
0.7
|
1
|
1.5
|
1.9
|
2.2
|
2.3
|
| 1983 |
2.3
|
2
|
1.5
|
1.2
|
1
|
0.6
|
0.2 | -0.2 | -0.6 | -0.8 | -0.9 | -0.7 |
| 1984 | -0.4 | -0.2 | -0.2 | -0.3 | -0.5 | -0.4 | -0.3 | -0.2 | -0.3 |
-0.6
|
-0.9
|
-1.1
|
| 1985 |
-0.9
|
-0.8
|
-0.7
|
-0.7
|
-0.7
|
-0.6
|
-0.5
|
-0.5
|
-0.5
|
-0.4 | -0.3 | -0.4 |
| 1986 | -0.5 | -0.4 | -0.2 | -0.2 | -0.1 | 0 | 0.3 |
0.5
|
0.7
|
0.9
|
1.1
|
1.2
|
| 1987 |
1.2
|
1.3
|
1.2
|
1.1
|
1
|
1.2
|
1.4
|
1.6
|
1.6
|
1.5
|
1.3
|
1.1
|
| 1988 |
0.7
|
0.5
|
0.1 | -0.2 |
-0.7
|
-1.2
|
-1.3
|
-1.2
|
-1.3
|
-1.6
|
-1.9
|
-1.9
|
| 1989 |
-1.7
|
-1.5
|
-1.1
|
-0.8
|
-0.6
|
-0.4 | -0.3 | -0.3 | -0.3 | -0.3 | -0.2 | -0.1 |
| 1990 | 0.1 | 0.2 | 0.2 | 0.2 | 0.2 | 0.2 | 0.3 | 0.3 | 0.3 | 0.3 | 0.3 | 0.4 |
| 1991 | 0.4 | 0.3 | 0.3 | 0.4 |
0.6
|
0.8
|
1
|
0.9
|
0.9
|
1
|
1.4
|
1.6
|
| 1992 |
1.8
|
1.6
|
1.5
|
1.4
|
1.2
|
0.8
|
0.5
|
0.2 | 0 | -0.1 | 0 | 0.2 |
| 1993 | 0.3 | 0.4 | 0.6 | 0.7 | 0.8 | 0.7 | 0.4 | 0.4 | 0.4 | 0.4 | 0.3 | 0.2 |
| 1994 | 0.2 | 0.2 | 0.3 | 0.4 |
0.5
|
0.5
|
0.6
|
0.6
|
0.7
|
0.9
|
1.2
|
1.3
|
| 1995 |
1.2
|
0.9
|
0.7
|
0.4 | 0.3 | 0.2 | 0 | -0.2 |
-0.5
|
-0.6
|
-0.7
|
-0.7
|
| 1996 |
-0.7
|
-0.7
|
-0.5
|
-0.3 | -0.1 | -0.1 | 0 | -0.1 | -0.1 | -0.2 | -0.3 | -0.4 |
| 1997 | -0.4 | -0.3 | 0 | 0.4 |
0.8
|
1.3
|
1.7
|
2
|
2.2
|
2.4
|
2.5
|
2.5
|
| 1998 |
2.3
|
1.9
|
1.5
|
1
|
0.5
|
0 |
-0.5
|
-0.8
|
-1
|
-1.1
|
-1.3
|
-1.4
|
| 1999 |
-1.4
|
-1.2
|
-0.9
|
-0.8
|
-0.8
|
-0.8
|
-0.9
|
-0.9
|
-1
|
-1.1
|
-1.3
|
-1.6
|
| 2000 |
-1.6
|
-1.4
|
-1
|
-0.8
|
-0.6
|
-0.5
|
-0.4 | -0.4 | -0.4 |
-0.5
|
-0.6
|
-0.7
|
| 2001 |
-0.6
|
-0.5
|
-0.4 | -0.2 | -0.1 | 0.1 | 0.2 | 0.2 | 0.1 | 0 | -0.1 | -0.1 |
| 2002 | -0.1 | 0.1 | 0.2 | 0.4 |
0.7
|
0.8
|
0.9
|
1
|
1.1
|
1.3
|
1.5
|
1.4
|
| 2003 |
1.2
|
0.9
|
0.5
|
0.1 | -0.1 | 0.1 | 0.4 | 0.5 | 0.6 | 0.5 | 0.6 | 0.4 |
| 2004 | 0.4 | 0.3 | 0.2 | 0.2 | 0.3 |
0.5
|
0.7
|
0.8
|
0.9
|
0.8
|
0.8
|
0.8
|
| 2005 |
0.7
|
0.5
|
0.4 | 0.4 | 0.4 | 0.4 | 0.4 | 0.3 | 0.2 | -0.1 | -0.4 | -0.7 |
| 2006 | -0.7 | -0.6 | -0.4 | -0.1 | 0.1 | 0.2 | 0.3 |
0.5
|
0.6
|
0.9
|
1.1
|
1.1
|
| 2007 |
0.8
|
0.4 | 0.1 | -0.1 | -0.1 | -0.1 | -0.1 | -0.4 |
-0.7
|
-1
|
-1.1
|
-1.3
|
| 2008 |
-1.4
|
-1.4
|
-1.1
|
-0.8
|
-0.6
|
-0.4 | -0.1 | 0 | 0 | 0 | -0.3 | -0.6 |
| 2009 | -0.8 | -0.7 | -0.5 | -0.1 | 0.2 |
0.6
|
0.7
|
0.8
|
0.9
|
1.2
|
1.5
|
1.8
|
| 2010 |
1.7
|
1.5
|
1.2
|
0.8
|
0.3 |